
15,000 agents on a synthetic provider. Finding loomcycle's real ceiling.
Yesterday's x1000 run ended on an honest anticlimax: the substrate held all 7,000 entities cleanly, but the agents starved - both Anthropic and Ollama cap parallel calls at roughly the number we needed at peak, so the test characterised the provider's ceiling instead of loomcycle's. The closing line was a promise: re-run it where the substrate hits its own limit, not the upstream's.
Today we did. The trick was to stop calling a real LLM at all. A synthetic provider - same wire shape as Anthropic, zero HTTP, zero quota, deterministic failure injection - removed the provider ceiling entirely and let us drive the substrate as hard as one laptop could push. The headline run: 5,000 circuits → 15,000 agent runs, all held live in memory at once, across 10,000 channels and 10,000 memory entries; 351,064 stored events; completed 5,000 / 5,000 in roughly four minutes, with 15% of every model call returning a synthetic 429 just to keep the retry-and-fallback machinery honest.
What "15,000 agents at once" means - precisely. All 15,000 agent runs are resident in loomcycle's memory at the same time: spawned, tracked, live. That part is literal. What's capped is how many execute in parallel - the harness gates concurrent circuits, so roughly 150 runs are actively stepping at any instant and the other ~14,850 wait their turn in memory, not parked on disk. So the simultaneity is real at the substrate level; the parallelism is throttled on purpose. The substrate's own admission ceiling (max_concurrent_runs: 2000) never became the binding constraint, and neither did its memory footprint - which is the genuinely interesting result. More at the end.
Why build a fake LLM
The circuit-stress harness shipped against anthropic-oauth-dev - it burns real MAX-subscription quota on every model call. Yesterday's run halted on ErrSubscriptionQuotaExhausted before it could characterise anything past ~x300, and scaling to 10K+ against a metered LLM is simply not economical. But the cost wasn't even the worst part. A real provider adds variance - latency jitter, intermittent 429s, occasional 5xx - and that variance is exactly the noise that hides the substrate's own bugs. You cannot tell a connection-pool regression apart from an upstream hiccup when both look like "a run took longer than expected."
So PR #244 added a mock provider that talks the same providers.Provider interface as every real driver, but answers from inside the process:
- Four model variants -
mock-researcher,mock-editor,mock-evaluator,mock-generic. Each is a tiny deterministic state machine: it counts thetool_resultblocks already in the request and returns the next tool call in its circuit's choreography (Memory.set→Channel.publish→Channel.subscribe→Evaluation.submit). The editor pulls itsrun_idout of a priorContext.selfresult; the evaluator scores deterministically viafnv32(run_id + circuit_id)mapped onto[0.50, 0.99]. Same run, same scores, every time. - Failure injection by env var -
LOOMCYCLE_MOCK_429_RATE,_500_RATE,_LATENCY_MS,_LATENCY_JITTER_MS, read once at startup, RNG mutex-protected. Crucially the mock does not wrap itself in the ratelimit middleware - the loop is supposed to see the injected 429s, so thatMarkRateLimited, same-provider retry, and provider fallback all get exercised by the same test. - Gated behind
LOOMCYCLE_MOCK_ENABLED=1so it can never accidentally register in a real deployment.
A second variant, mock-stable (PR #247), is identical but never injects failures. It exists to be the fallback target: configure mock as the primary with a 15% 429 rate and mock-stable as the fallback, and you have a closed-loop test of the entire resilience path - primary rate-limits, the loop retries, then escalates to a clean fallback - with not a single real network packet involved.
The scale ladder
The same three-agent circuit as yesterday (researcher → editor → evaluator, coordinated only through the Channel bus), run at increasing scale and increasing injected-error rate:
| Scenario | Circuits | Agent runs | 429 inject | Result | Wall | p99 |
|---|---|---|---|---|---|---|
| Clean baseline | 1,000 | 3,000 | 0% | 1000 / 1000 | ~37 s | 2.6 s |
| Single provider, no fallback | 1,000 | 3,000 | 10% | 185 / 1000 | ~22 min | - |
| Retry + fallback | 1,000 | 3,000 | 10% | 1000 / 1000 | ~42 s | 5.0 s |
| Scale-up | 2,000 | 6,000 | 15% | 2000 / 2000 | ~72 s | 3.2 s |
| Ceiling probe | 5,000 | 15,000 | 15% | 5000 / 5000 | ~235 s | 5.8 s |
The second row is the one that mattered. A 10% injected 429 rate, on a single provider with no fallback, collapsed completion to 185 of 1,000 - and then spent twenty-two minutes failing slowly. That is not a substrate-capacity problem; it is a policy bug, and finding it is the entire reason the mock provider exists.
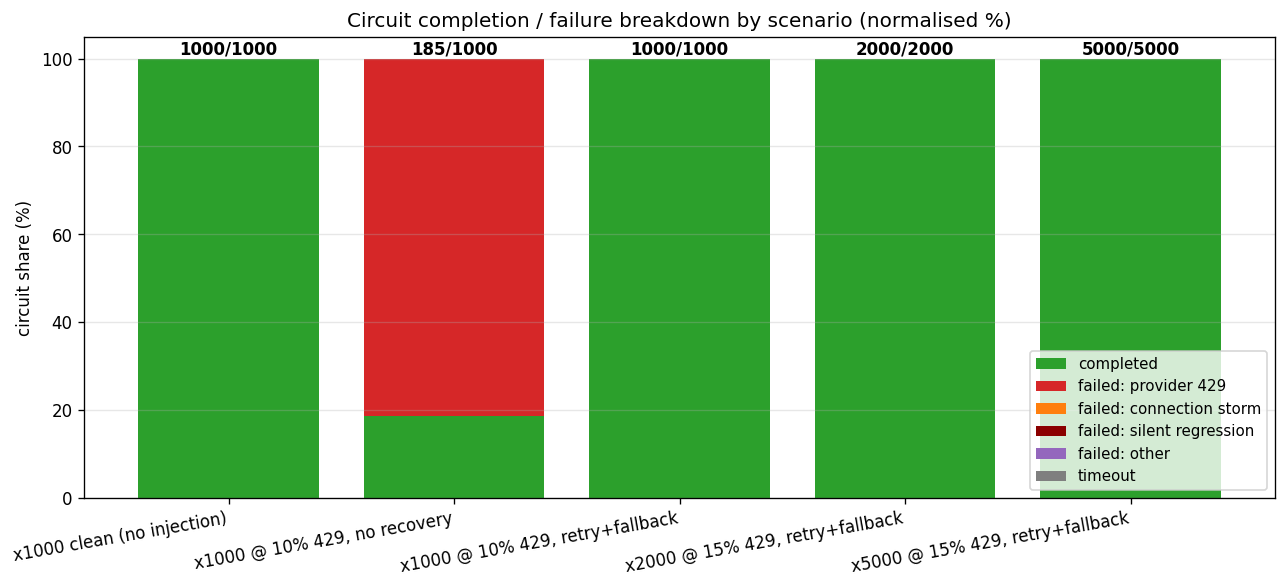
Bug one - the launch-storm connection failure
The clean x1000 baseline didn't start clean. The first attempt landed 985 / 1000: eleven hard failures and - worse - four silent regressions. All four traced to the same five-second window at the start of the run, when ~3,000 POSTs hit Postgres at once, the pool tried to grow past 100 connections, and the server rejected the overflow with SQLSTATE 53300 - "sorry, too many clients already."
The hard failures were honest; they surfaced as errors. The silent ones were the dangerous shape: a Memory.set whose connection got rejected returned no error to the agent, the next agent read back null, and the pipeline completed - producing a confidently empty result. Only the harness's strict-output validator caught it. A run that "succeeds" while having silently dropped a write is precisely the failure mode you never want a customer to be the first to find.
PR #246 fixed both layers. Operationally: drop the pool cap from 128 to 80 (comfortably under Postgres' default max_connections=100, with headroom for the sweeper, psql, and cluster locks), and start the test container with max_connections=200 so an over-eager config can't reintroduce the storm. Structurally: a retryOnTransientConn helper around the five high-volume launch-storm write paths, with three attempts at 50 / 150 ms backoff. Its classifier is deliberately narrow - it matches connection-establishment failures only (53300, "too many clients", "connection refused"). A mid-query EOF stays non-retryable, because the INSERT may have committed before the wire dropped, and retrying a maybe-committed write is how you get duplicates. Result: silent regressions went from four to zero, and stayed there through every scenario above.
Bug two - the cooldown cascade
Real-provider 429s usually clear in one to three seconds. But the v0.12.x loop fired MarkRateLimited - a hard 30-second cooldown - on the first retryable error, then immediately escalated to provider fallback, or failed outright if none was configured. Under a sustained 10% error rate with no fallback, the cooldowns dominated: 185 circuits squeaked through before the matrix was mostly in timeout, and the remaining 815 spent twenty-two minutes bouncing off cooldowns that were an order of magnitude longer than the condition they were reacting to.
PR #247 adds a same-provider retry budget that fires before MarkRateLimited ever engages. On a retryable error, if the per-(provider, model) counter is under the operator's cap, the loop sleeps with exponential backoff (100 ms / 300 ms / 900 ms / 2.7 s / 8.1 s) and re-issues against the same pair - emitting EventRetry frames to the SSE stream so consumers see the retry live. The counter resets on any successful call or fallback switch. Permanent errors (400 / 401 / 403 / 422 / context.Canceled) are never retried regardless of budget - they surface immediately, because hiding a real 401 behind a retry loop just wastes wall-clock. The knob lives next to the other resilience settings as UserTier.RetryAttempts. Same 10% scenario, with retry + a mock-stable fallback: 1000 / 1000 in 42 seconds.
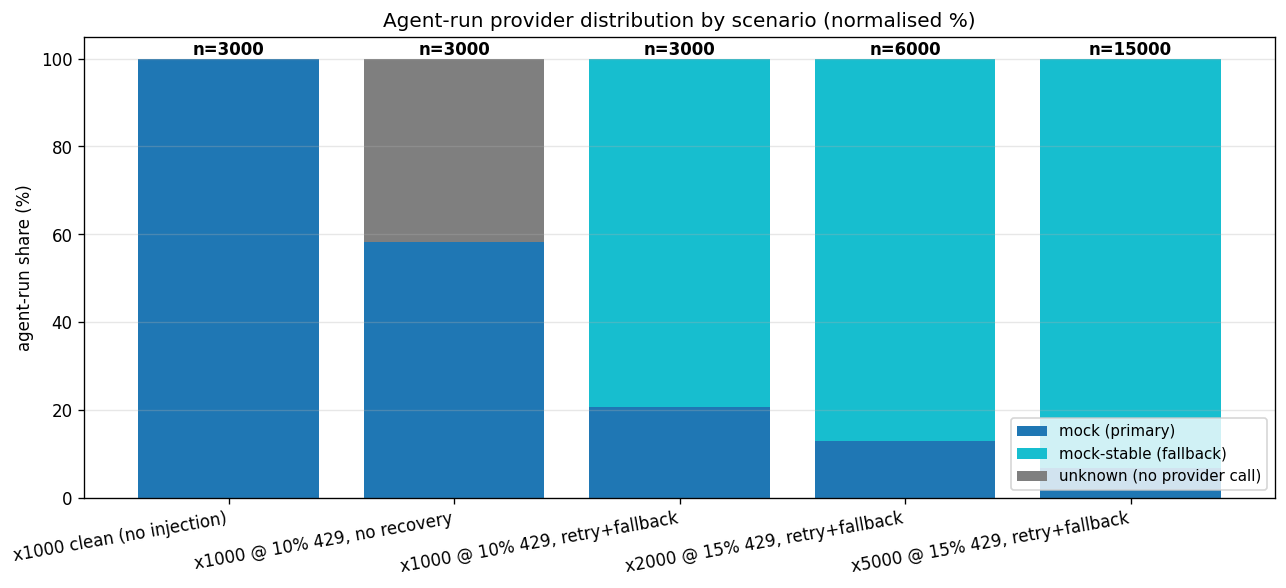
MarkRateLimited cooldown steers most new admits straight to the clean mock-stable provider, so the majority finish there rather than on the rate-limited primary - without a per-run fallback hop. Only a handful of true cross-provider fallback events fire; most recovery happens at the retry layer. No run is lost to the error storm.The counterintuitive part: more load, better tail
Look back at the ladder. The 2,000-circuit run at a 15% error rate posted a better p99 (3.2 s) than the 1,000-circuit run at a 10% rate (5.0 s). More circuits, more injected failures, lower tail latency. That looks wrong until you trace a single run through the resolver.
At the higher error rate, a larger fraction of runs are admitted directly against mock-stable once the resolver matrix has cooled the rate-limited primary - which never injects a failure and answers immediately. They skip the exponential-backoff ladder entirely. The runs that still land on the flaky primary are the ones paying the 100 ms / 300 ms / 900 ms tax, and they're what stretches the tail. Raise the failure rate and you shift more of the population onto the fast, clean path. It's a real effect, not a measurement artifact - and a good reminder that "p99 got better under more stress" can be a sign your fallback routing is working, not a sign your instrumentation is broken. (It holds only while parallelism is capped - turn that knob up and a very different cost appears, as the next section shows.)
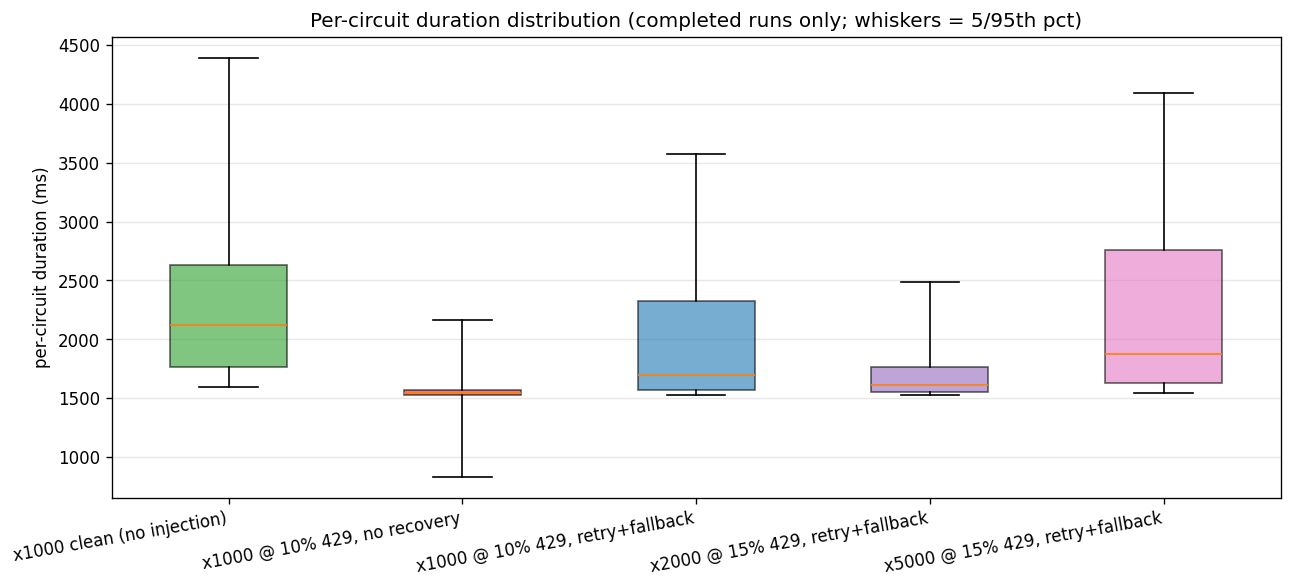
Bug three - the only thing x5000 broke
The 5,000-circuit run completed fully, but it logged ten identical warnings, all clustered inside a one-second window at the launch crest:
store: UpdateHeartbeat(r_…) failed: timeout: context deadline exceeded
The first diagnosis (written into the bottleneck doc) blamed run-context inheritance - and was wrong. makeHeartbeat already uses context.Background() with its own deadline. The real cause was simpler: that deadline was 1 second, and at the crest, the ~150 runs executing in parallel each cycling Memory.set / Channel.publish / AppendEvent contend for the 80-connection pool. Most acquires return in under 100 ms; a handful overshoot a second; the deadline fires and logs noise on runs that are otherwise perfectly healthy. Heartbeats are advisory - the stale-run sweeper's window is 60 s+, so a missed beat or two is invisible to it. The runs were never at risk. But a cluster of scary-looking timeout warnings is the kind of thing that, at higher scale, could mask a real outage.
The fix (PR #249) bumps the heartbeat deadline 1 s → 5 s - sized for tolerance, not freshness. Notably, the retryOnTransientConn helper from PR #246 does not apply here: this error is context.DeadlineExceeded, not SQLSTATE 53300, and the classifier is intentionally narrow enough to tell them apart. Five new tests pin the behaviour via a delaying-store wrapper: a 2 s delay now passes silently; a 7 s delay logs the deadline and returns without touching the run.
What it cost in resources
This is where the two-axis picture shows up in the raw numbers. Heap tracks residency - it scales nearly 1:1 with circuit count (168 MB at x1000 → 269 MB at x2000 → 520 MB at x5000), because every resident run costs about 35 KB whether it's executing or waiting, which is exactly why parking 14,850 idle runs in memory rather than on disk is affordable. Goroutines and active-runs track parallelism - and they barely move with scale: ~150 active and ~550 goroutines at x1000, x2000, and x5000 alike (559 / 517 / 552), because the harness capped parallel execution at ~140 no matter how many total circuits were resident. A waiting run is parked state, not a parked thread. No leak signature across the ladder; each scenario returned to baseline between runs.
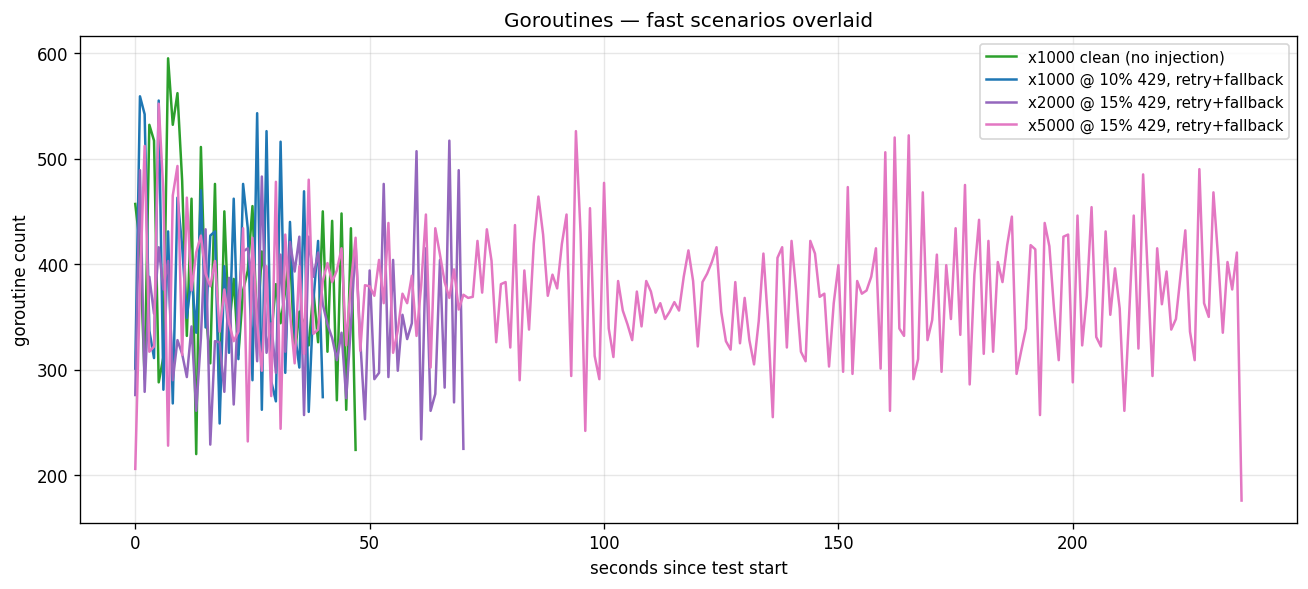
One honest gap in the numbers: these runs were on macOS, where the /proc-based RSS and CPU sampling returns 0 - those metrics are Linux-only. Heap and goroutine figures come from Go's own runtime and are trustworthy; process-level RSS and CPU for this ladder are simply not captured yet. A Linux re-run to fill that gap is the next item.
The ceiling we actually hit
Here's the part that matters most, and the part it's easy to get wrong in either direction - because two different numbers are doing two different jobs. Residency: all 15,000 agent runs were held live in memory at once. That axis we genuinely exercised, and it cost ~520 MB of heap - about 35 KB per run. Parallel execution: only ~150 of those stepped at any instant, because the harness gates concurrent circuits (its semaphore lives in test/load/circuit-stress/main.go), and the rest waited their turn in memory. The substrate's own admission gate (max_concurrent_runs: 2000) never became the binding constraint - the harness's launch semaphore did, well below it.
So the ~235-second wall clock was a parallelism number, not a capacity number: drain 15,000 runs at ~150 executing at a time and four minutes is what you get. The substrate held all 15,000 resident and processed every one - 351,064 stored events, zero structural failures, zero dropped writes - but it never broke a sweat, because the harness throttle sat well below its real limit. So we lifted it: PR #250 raised the launch gate 10× (50 → 500 concurrent circuits), and we re-ran the exact same x5000 / 15%-injection workload on a host with more CPU. This time the substrate's own ceiling finally showed up.
The bottleneck, finally: pgxpool contention
Same 15,000 agent runs, same 15% injected error rate, same circuit. The only changes: the launch gate went 50 → 500, and the heartbeat-budget fix from the last section was in place. Here is what 10× the parallelism did:
| Axis | Gate = 50 | Gate = 500 |
|---|---|---|
| Completion | 5000 / 5000 | 5000 / 5000 |
| Peak active runs | 141 | 1,500 |
| Peak goroutines | 552 | 7,568 |
| Peak heap (in-use) | 520 MB | 4.1 GB |
| Queued runs | 0 | 0 |
| p50 latency | 1.9 s | 36 s |
| p99 latency | 5.8 s | 62 s |
| Wall time | 235 s | 398 s |
| Heartbeat timeouts | 10 | 0 |
| Substrate errors | 0 | 0 |
Read the two rows that didn't move first. Completion stayed 5,000 / 5,000, substrate errors stayed at zero, and the admission queue never left zero - even at 1,500 concurrent active runs. The configured max_concurrent_runs: 2000 cap was approached but never actually became the binding constraint, which means max_queue_depth: 30000 is wildly over-provisioned for any sane pool size. The heartbeat fix held perfectly: at ~7,500 goroutines and a saturated pool, the old 1-second budget would have logged hundreds of timeout warnings; the new 5-second budget logged zero.
What moved was latency - p50 from 1.9 s to 36 s, p99 from 5.8 s to 62 s - and the cause is specific and unglamorous. At 1,500 active runs, each circuit cycles roughly 25 store operations (Memory.set / Channel.publish / AppendEvent / FinishRun) through a pool of 80 connections. Every one of those ops now waits its turn for a free connection. The 36-second p50 isn't work - it's line-up time at the pool. The substrate's per-iteration cost is unchanged; the runs are just standing in a queue for a database handle.
This is the headline result, and it's the useful one. loomcycle's real bottleneck at 1,000+ concurrent runs is pgxpool size and per-op connection queueing - full stop. Not the agent loop. Not the channel bus (10,000 channels, zero observed contention). Not memory (15,000 writes, clean). Not the goroutine scheduler (7,568, far under Go's ceiling). Not heap (4 GB, linear, comfortable inside an 8 GB binary). The pool is the wall, and now we know exactly where it sits.
That turns the next stretch of work into a concrete, three-option roadmap rather than a hunch:
- Bump
pg_max_open_conns- the cheapest lever, operator-side. Trades Postgres connection slots for pool headroom; buys linear relief until Postgres itself becomes the constraint. - Shard the agent → connection assignment - partition the pool so a run's hot-path store ops contend within a slice rather than all 1,500 actors fighting over the same 80 handles.
- Per-replica caching for hot-path ops - keep the highest-frequency reads and writes (heartbeat, channel cursor) out of the pool entirely, served from a per-replica cache.
One honest caveat on what 36-second p50 means. For an offline or background workload - 5,000 circuits drained in ~7 minutes - it's fine. For an interactive use case it would not be. But note the synthetic provider's near-zero think time is what made the pool contention this visible this fast: a real LLM at 1-3 s per call stretches each circuit ~25×, which pushes the same pool ceiling out to "much higher concurrency at much lower query-per-second" terrain. With real models, you hit this wall later and more gently - but it's the same wall, and now it's mapped.
What's next
- Attack the pool ceiling along the three paths above - starting with the
pg_max_open_connsbump to confirm the latency curve flattens, then the structural fixes (sharding, hot-path cache) for the cases a bigger pool can't buy out. - Cluster-mode mock load - the same synthetic harness against a two-replica deployment, which spreads the pool load across replicas and exercises the Postgres
LISTEN/NOTIFYbackplane and advisory-locked singletons under real contention. - Re-run on Linux to capture the RSS and CPU curves the macOS host couldn't (its
/procsampler returns zero), now that we know CPU and pool - not heap - are the axes worth watching.
A synthetic provider that costs nothing to run, deterministic enough to reproduce a bug on demand, and faithful enough to the real wire shape that it exercises the actual retry-and-fallback path. Three real bugs surfaced and shipped - a silent-write storm, a 22-minute cooldown cascade, a heartbeat-budget misfire - none of which a metered, variance-laden real provider would have let us isolate. Then, with the harness throttle lifted, the substrate held 15,000 resident runs and 1,500 of them executing at once, completed all 5,000 circuits with zero errors, and handed us its real bottleneck on a plate: the connection pool. That's the most valuable thing a stress test can produce - not a victory-lap number, but the exact name of the next thing to fix.
Companion writeups: 3000 agents + 2000 memories + 2000 channels in one stress test (yesterday - the real-provider run that motivated building the mock), and Multi-replica HA - the seven phases that get loomcycle close to v1.0 (the cluster surfaces the next load test will exercise).