
Reliable under stress, sustainable for hours: eight load experiments in three days.
Yesterday's writeup closed open. The synthetic mock provider had lifted the cost ceiling. The launch-storm and cooldown-cascade bugs were fixed. The substrate absorbed 15,000 agent runs in one shot, and named the next-deepest bottleneck (pgxpool contention) without solving it. The follow-up list was short: cluster, Linux, sustained, find the real saturation knee.
Three days later, on the same 32-thread Linux box, we have eight experiments. The first seven (two days ago): single-binary baseline, cluster burst across r ∈ {1, 2, 3, 4}, cancel + crash injectors, 15-minute sustained, 30-minute sustained with a live OpenTelemetry stack, a capacity ramp to x5000, a saturation ramp to x10000. The eighth (last night): an 8-hour stability soak. 1,268,000 circuits, 3,804,000 agent runs, 100.00 % completion across 468 waves of continuous load.
The first seven characterised the substrate's shape under burst, sustained, and saturation. The eighth tested whether anything breaks when the substrate runs without a break. Plus two findings the 8-hour run surfaced that the first seven experiments couldn't see.
The eight experiments at a glance
| # | Experiment | Replicas | Scale / Duration | Headline result |
|---|---|---|---|---|
| 1 | Single-binary Linux baseline | 1 | x10,000 burst | 100 % / 10,000 · p99 = 4.0 s · peak active ~1,500 |
| 2 | Cluster burst sweep | {1, 2, 3, 4} | x5,000 per run | Sharp r=2 → r=3 phase transition · p99 collapses 15× (54 s → 3.6 s) |
| 3 | Cancel + crash injection | 3 | x5,000 + 127 cancels / 1 docker-kill | Cancel ack p99 = 130 ms · crash reaper at T+20 s · zero zombies, zero quota leak |
| 4 | 15-min sustained | 4 | x1000 → x2000 → x1000 · 46 waves | 56,000 / 168,000 runs · 100 % · 0.7 % load spread · no drift |
| 5 | 30-min sustained + live OTEL | 4 | same shape, 90 waves | 109,000 / 327,000 runs · 100 % · 0.5 % spread · ~180 runs/sec · OTEL adds ~8 % p50 |
| 6 | Capacity probe | 4 | x3000 → x4000 → x5000 ramp | Wave wall perfectly linear · slope = 16 s per +1000 circuits · p99 flat 3.6-4.2 s |
| 7 | Saturation probe | 4 | x6000 → x8000 → x10000 ramp | Knee found x6000 → x8000 · soft ceiling ~6,650 circuits/wave · no cliff |
| 8 | 8-hour stability soak | 4 | x2000 → x3000 → x4000 · 160 min each · 468 waves | 1,268,000 / 3,804,000 runs · 100.00 % · 0.14 % spread · zero leaks · two unexplained step-ups |
Hardware was the same across all of them: a single 32-thread Intel Xeon E5-2697A v4, 62 GB RAM, Linux 6.17, Docker 29.5, Postgres 16.14. One box. Where the prior session used macOS (where /proc-based RSS and CPU sampling returns zero - the platform-blind gap from yesterday's post), this entire campaign ran on Linux with the substrate's process-resource sampler fully populated. Per-replica pool sized so the cluster total stayed under Postgres' max_connections with headroom for psql + sweeper + the LISTEN/NOTIFY backplane.
Experiment 1 - single-binary on Linux: the reference number
Same workload that ended yesterday's writeup with a 36-second p50 on macOS at launchSem=500. Re-running it on Linux with real /proc sampling: x10,000 circuits → 100 % completion · p99 = 4.0 s · peak active runs ≈ 1,500. The launchSem-500 number from yesterday (62 s p99 on a CPU-starved macOS host) shrinks to 4.0 s once the runtime gets the cores it expects. That's the reference number every cluster experiment after this is measured against.
The shape worth noting: peak active runs sat at ~1,500 - that's where the harness's lifted launch gate finally pushed in-flight admissions, and where the substrate's own admission ceiling (max_concurrent_runs: 2000) still never engaged. The drain rate kept up. The pgxpool stayed tight. No silent regressions. No leak signature.
Experiment 2 - the cluster's sharp phase transition
Same workload, this time pushed through N replicas behind nginx, sharing one Postgres - the full v0.12.x cluster substrate: LISTEN/NOTIFY backplane, replicas table, advisory-locked singletons, DB-backed quotas and hooks. Single hardware, different replica counts:
| Replicas | Scale | Completion | p50 | p99 | Cross-replica | Silent regr. |
|---|---|---|---|---|---|---|
| 1 | 5,000 | 40 % | 2.5 s | 56.7 s | n/a | 39 |
| 2 | 5,000 | 75 % | 2.6 s | 53.8 s | 75 % | 135 |
| 3 | 5,000 | 100 % | 2.5 s | 3.6 s | 89 % | 0 |
| 4 | 5,000 | 100 % | 2.5 s | 3.5 s | 94 % | 0 |
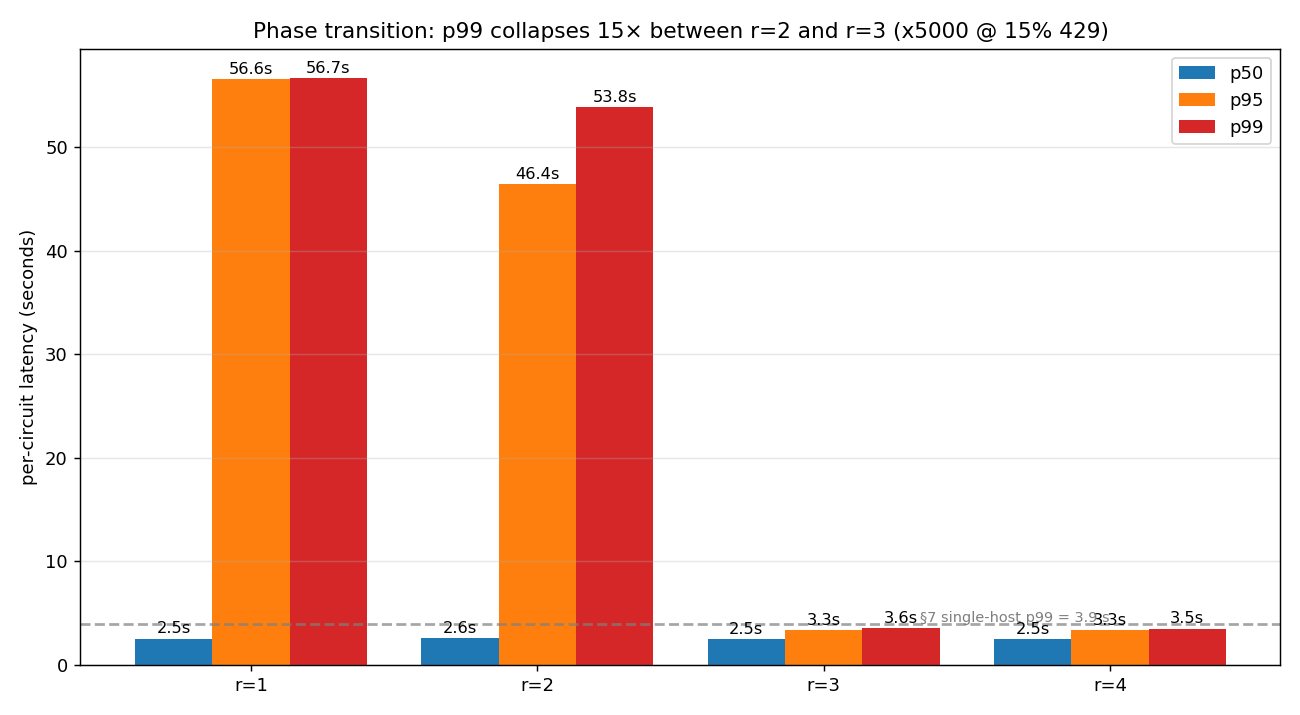
Three observations the table only half-tells. First, r=1 cluster mode is worse than the single-binary host - 40 % completion versus the baseline's 100 %, on the same hardware. The cluster substrate adds real per-replica overhead (LISTEN sessions, DB-backed quotas, hook bookkeeping) that consumes connection-pool budget the non-cluster binary keeps for application work. Cluster mode is not free; the choice to enable it is a deployment decision, not a free upgrade.
Second, the transition between r=2 and r=3 isn't smooth. It's a step function around the per-replica saturation knee - at r=2 each replica is at its own knee and the queue tail explodes; at r=3 the load splits enough that no replica is at its knee, and p99 drops back to a neighborhood of the single-host reference. This is the practical lesson for operators: "add a replica" doesn't help linearly; it helps in cliffs. Three replicas was the smallest number that crossed the knee for this workload on this hardware.
Third, cross-replica fan-out works at scale. At r ≥ 3, 89-94 % of circuits had agents that landed on different replicas - meaning the editor and evaluator subscribed to channels via Postgres LISTEN/NOTIFY from a different process than the publisher, and every one of those traversals succeeded. The cluster isn't just admitting requests across replicas; the substrate primitives compose correctly across the wall.
Experiment 3 - cancel and crash, named in the data
Two injectors on top of the r=3 cluster, each exercising a specific cluster-mode primitive:
The cancel coordinator. 127 of the 5,000 in-flight runs were cancelled from a different replica than the one running them. The cancel flow goes: HTTP DELETE /v1/runs/{id} at one replica → NOTIFY loomcycle.cancel on Postgres → owning replica receives the LISTEN, terminates the loop, fires NOTIFY loomcycle.cancel.ack back. Result: 127 / 127 cancels acked. p50 ack = 21 ms, p99 = 130 ms, max = 176 ms - roughly 38× headroom under the default 5-second LOOMCYCLE_CANCEL_ACK_TIMEOUT_MS. The Postgres backplane is fast enough that "wait for an ack from another replica" reads as a local operation.
The replica-died reaper. One replica was docker killed mid-run. The cluster left zero zombies, zero quota leak, and fired the dead-replica reaper as a single batched UPDATE around T+20 s. The literal in the data is stop_reason='replica_died' (from coord/replicas_sweeper.go) - distinct from 'owner_replica_dead', which is a different code path (coord/cancel_coordinator.go) that fires only when a cancel POST races a replica death. Two reaper paths, both observable, both named. The first report draft's "open question" about which path fires when is now resolved by the test data itself.
One operational gotcha worth surfacing: pre-fix runs lost 3-50 % of circuits to nginx 500s caused by the LB container's default nofile=1024. Fixed by adding explicit ulimits.nofile=65536 + nginx worker_rlimit_nofile=65536 + worker_connections=16384. The lesson generalises beyond loomcycle: under any high-concurrency workload, the LB's file-descriptor ceiling is operator-supplied, and a forgotten ulimit bottlenecks the rest of the system invisibly.
Experiment 4 - 15 minutes of nothing happening
r=4 cluster, three back-to-back phases over fifteen minutes: x1000 sustained for 5 min → x2000 sustained for 5 min → x1000 sustained for 5 min, with the orchestrator firing the circuit-stress driver in back-to-back waves until each phase elapsed. The point: does the cluster drift under continuous pressure?
56,000 circuits. 168,000 agent runs. 46 waves. 100 % completion. Zero silent regressions. Zero stuck rows. Zero quota leak. Load split across the four replicas: 42,112 / 41,954 / 42,117 / 41,817 - a 0.7 % spread.
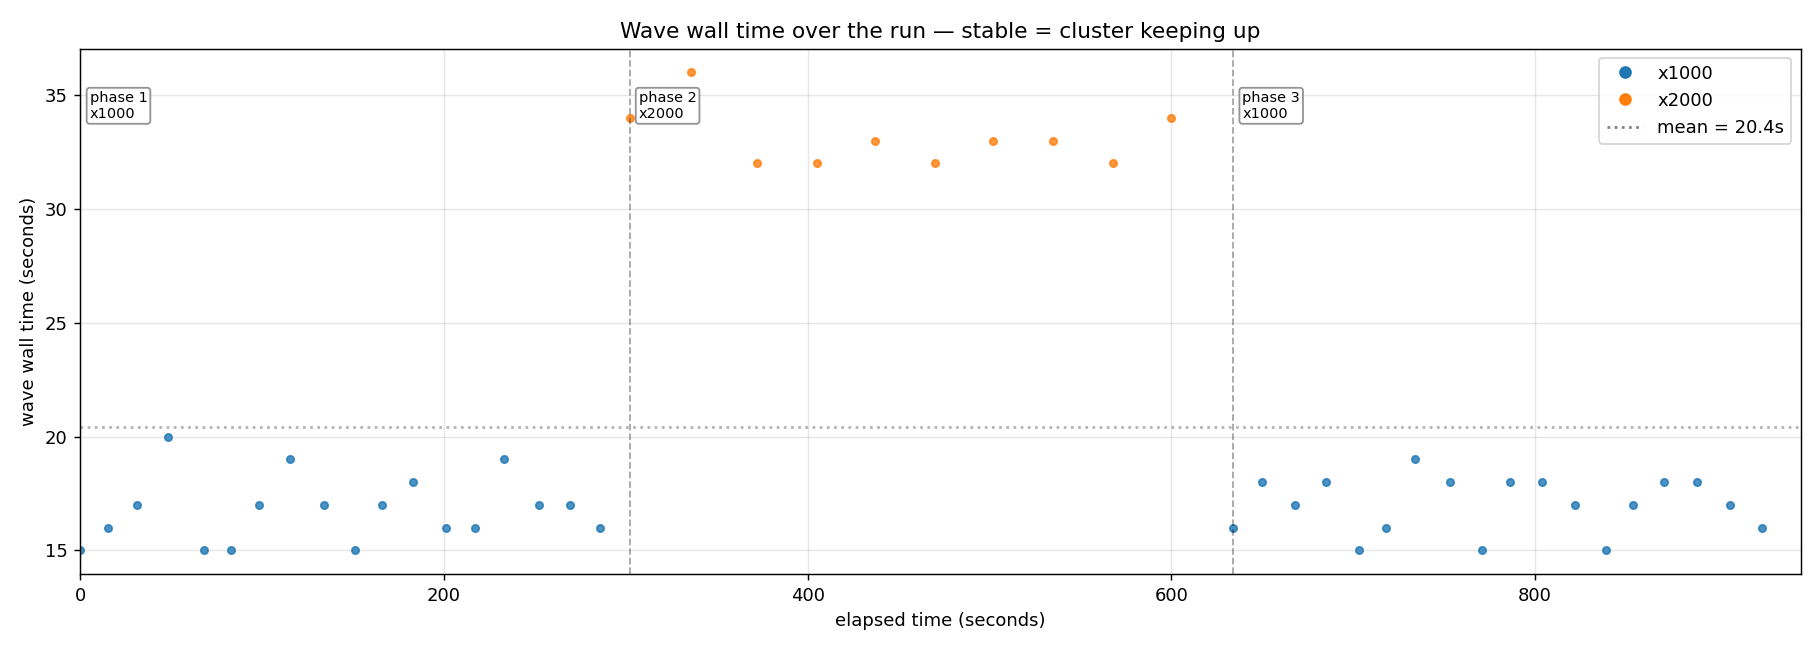
The single cleanest "cluster keeping up" indicator is in that chart. If the cluster were saturating under the x2000 spike, phase 2 walls would diverge upward. They don't - they sit flat at twice phase 1, which is exactly what linear scaling looks like. If the cluster carried residual state from phase 2 into phase 3, phase-3 walls would be elevated. They aren't - they're statistically indistinguishable from phase 1. RSS oscillates with the GC sawtooth but the rolling-mean envelope is flat across the entire 15 minutes. Goroutines stay bounded. Throughput holds at ~178 agent runs per second sustained.
Chart looks dull. That's what you want. For a sustained-load curve, "nothing interesting happens" is the ideal shape, and a non-trivial property to demonstrate. Every leak and every queue-collapse bug shows up as drift over time.
Experiment 5 - 30 minutes, with a live observability stack alongside
Same shape, double the duration, and this time the full Profile A OTEL stack (Grafana + Tempo + Prometheus + Loki + OTEL Collector) was brought up in the same compose, each replica exporting OTLP spans to a shared collector at sampler ratio 1.0 (every span exported). Two questions this answered that the prior run couldn't: does the cluster stay healthy at 2× duration, and does the OTEL pipeline itself hold up under the same load it's observing?
109,000 circuits. 327,000 agent runs. 90 waves. 100 % completion across all of them. Zero silent regressions. Throughput identical to the 15-minute run - ~180 runs/sec sustained for the full thirty minutes. Load split across r=1/2/3/4 = 81,818 / 81,990 / 81,650 / 81,542 - a 0.5 % spread, tighter than 15-min (more waves = more averaging).
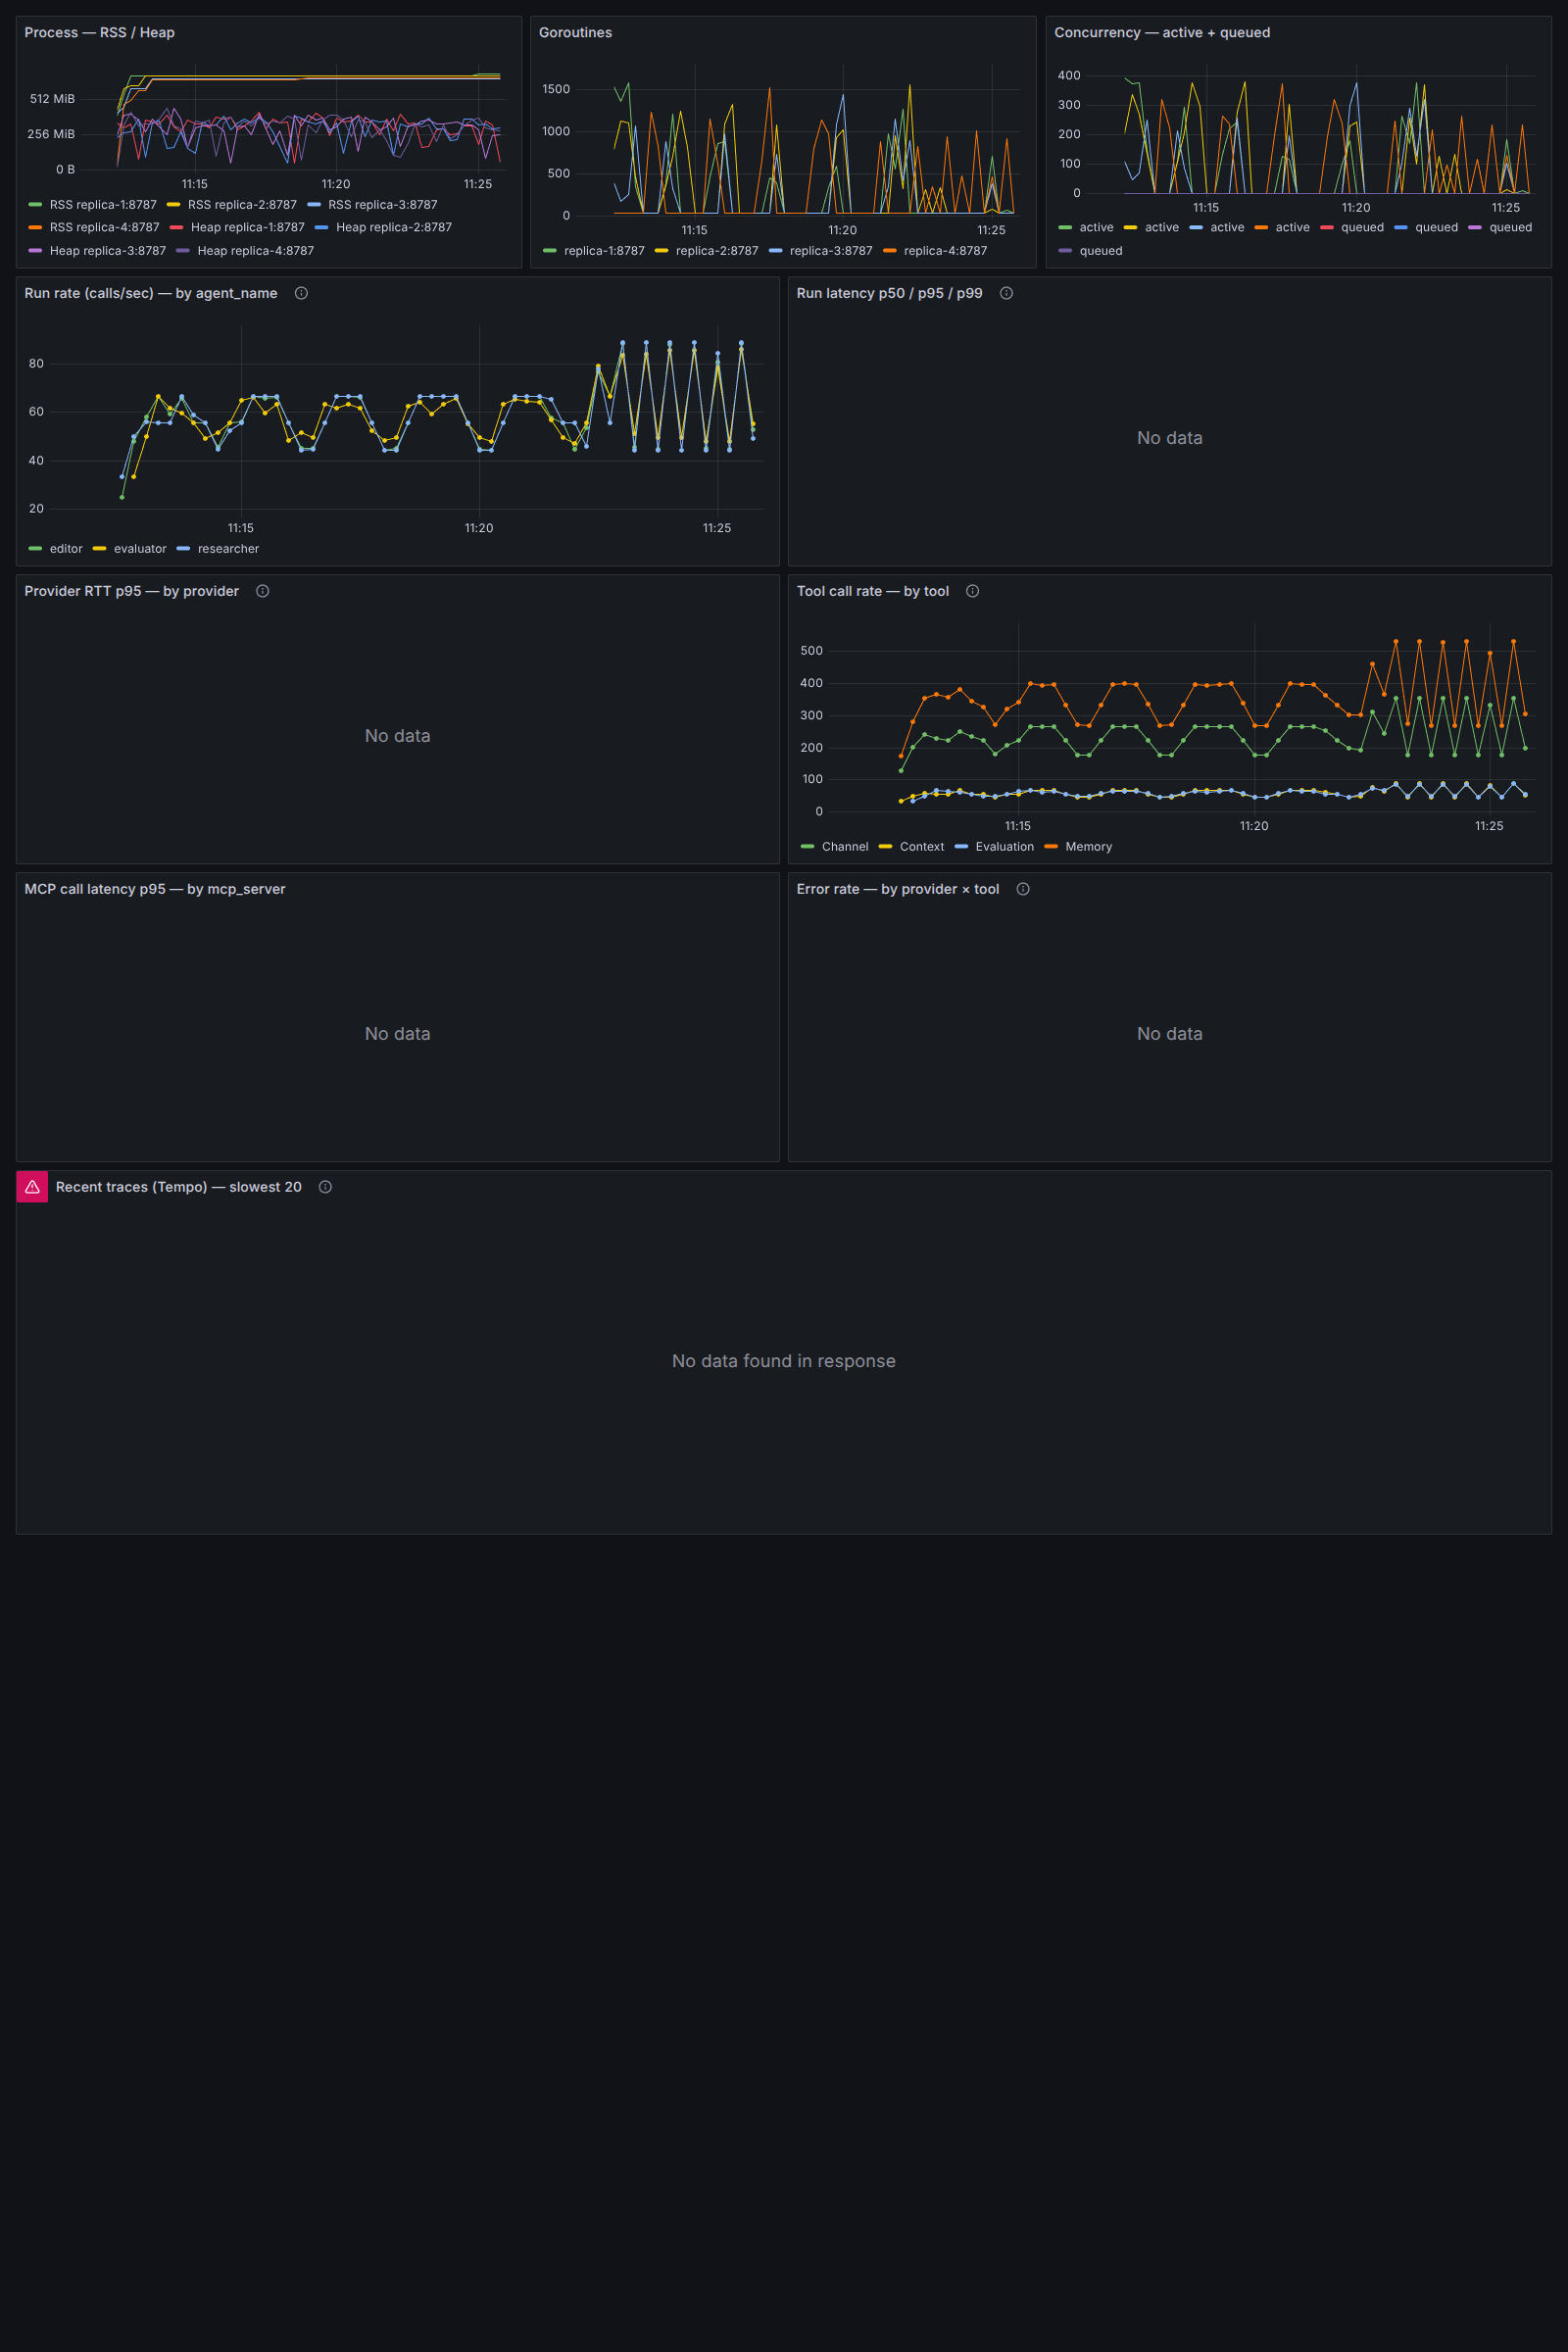
agent_name shows the step-up from phase 1 → phase 2; goroutines + RSS + concurrency all elevate proportionally; tool call rate doubles. Captured live while the run was in flight; no panel turned red.The OTEL stack cost about +8 % p50 compared to the 15-min run without it - most plausibly the cost of serialising every span and shipping it over OTLP/HTTP at sampler ratio 1.0. The cluster absorbed it cleanly inside its capacity envelope: no degradation in completion, throughput, or load distribution. A production deployment would drop the sampler ratio to 0.1 or lower, eliminating that overhead while still capturing trace samples for slow-path investigation. The point of running at 1.0 here was to stress the export path, not to ship the production config.
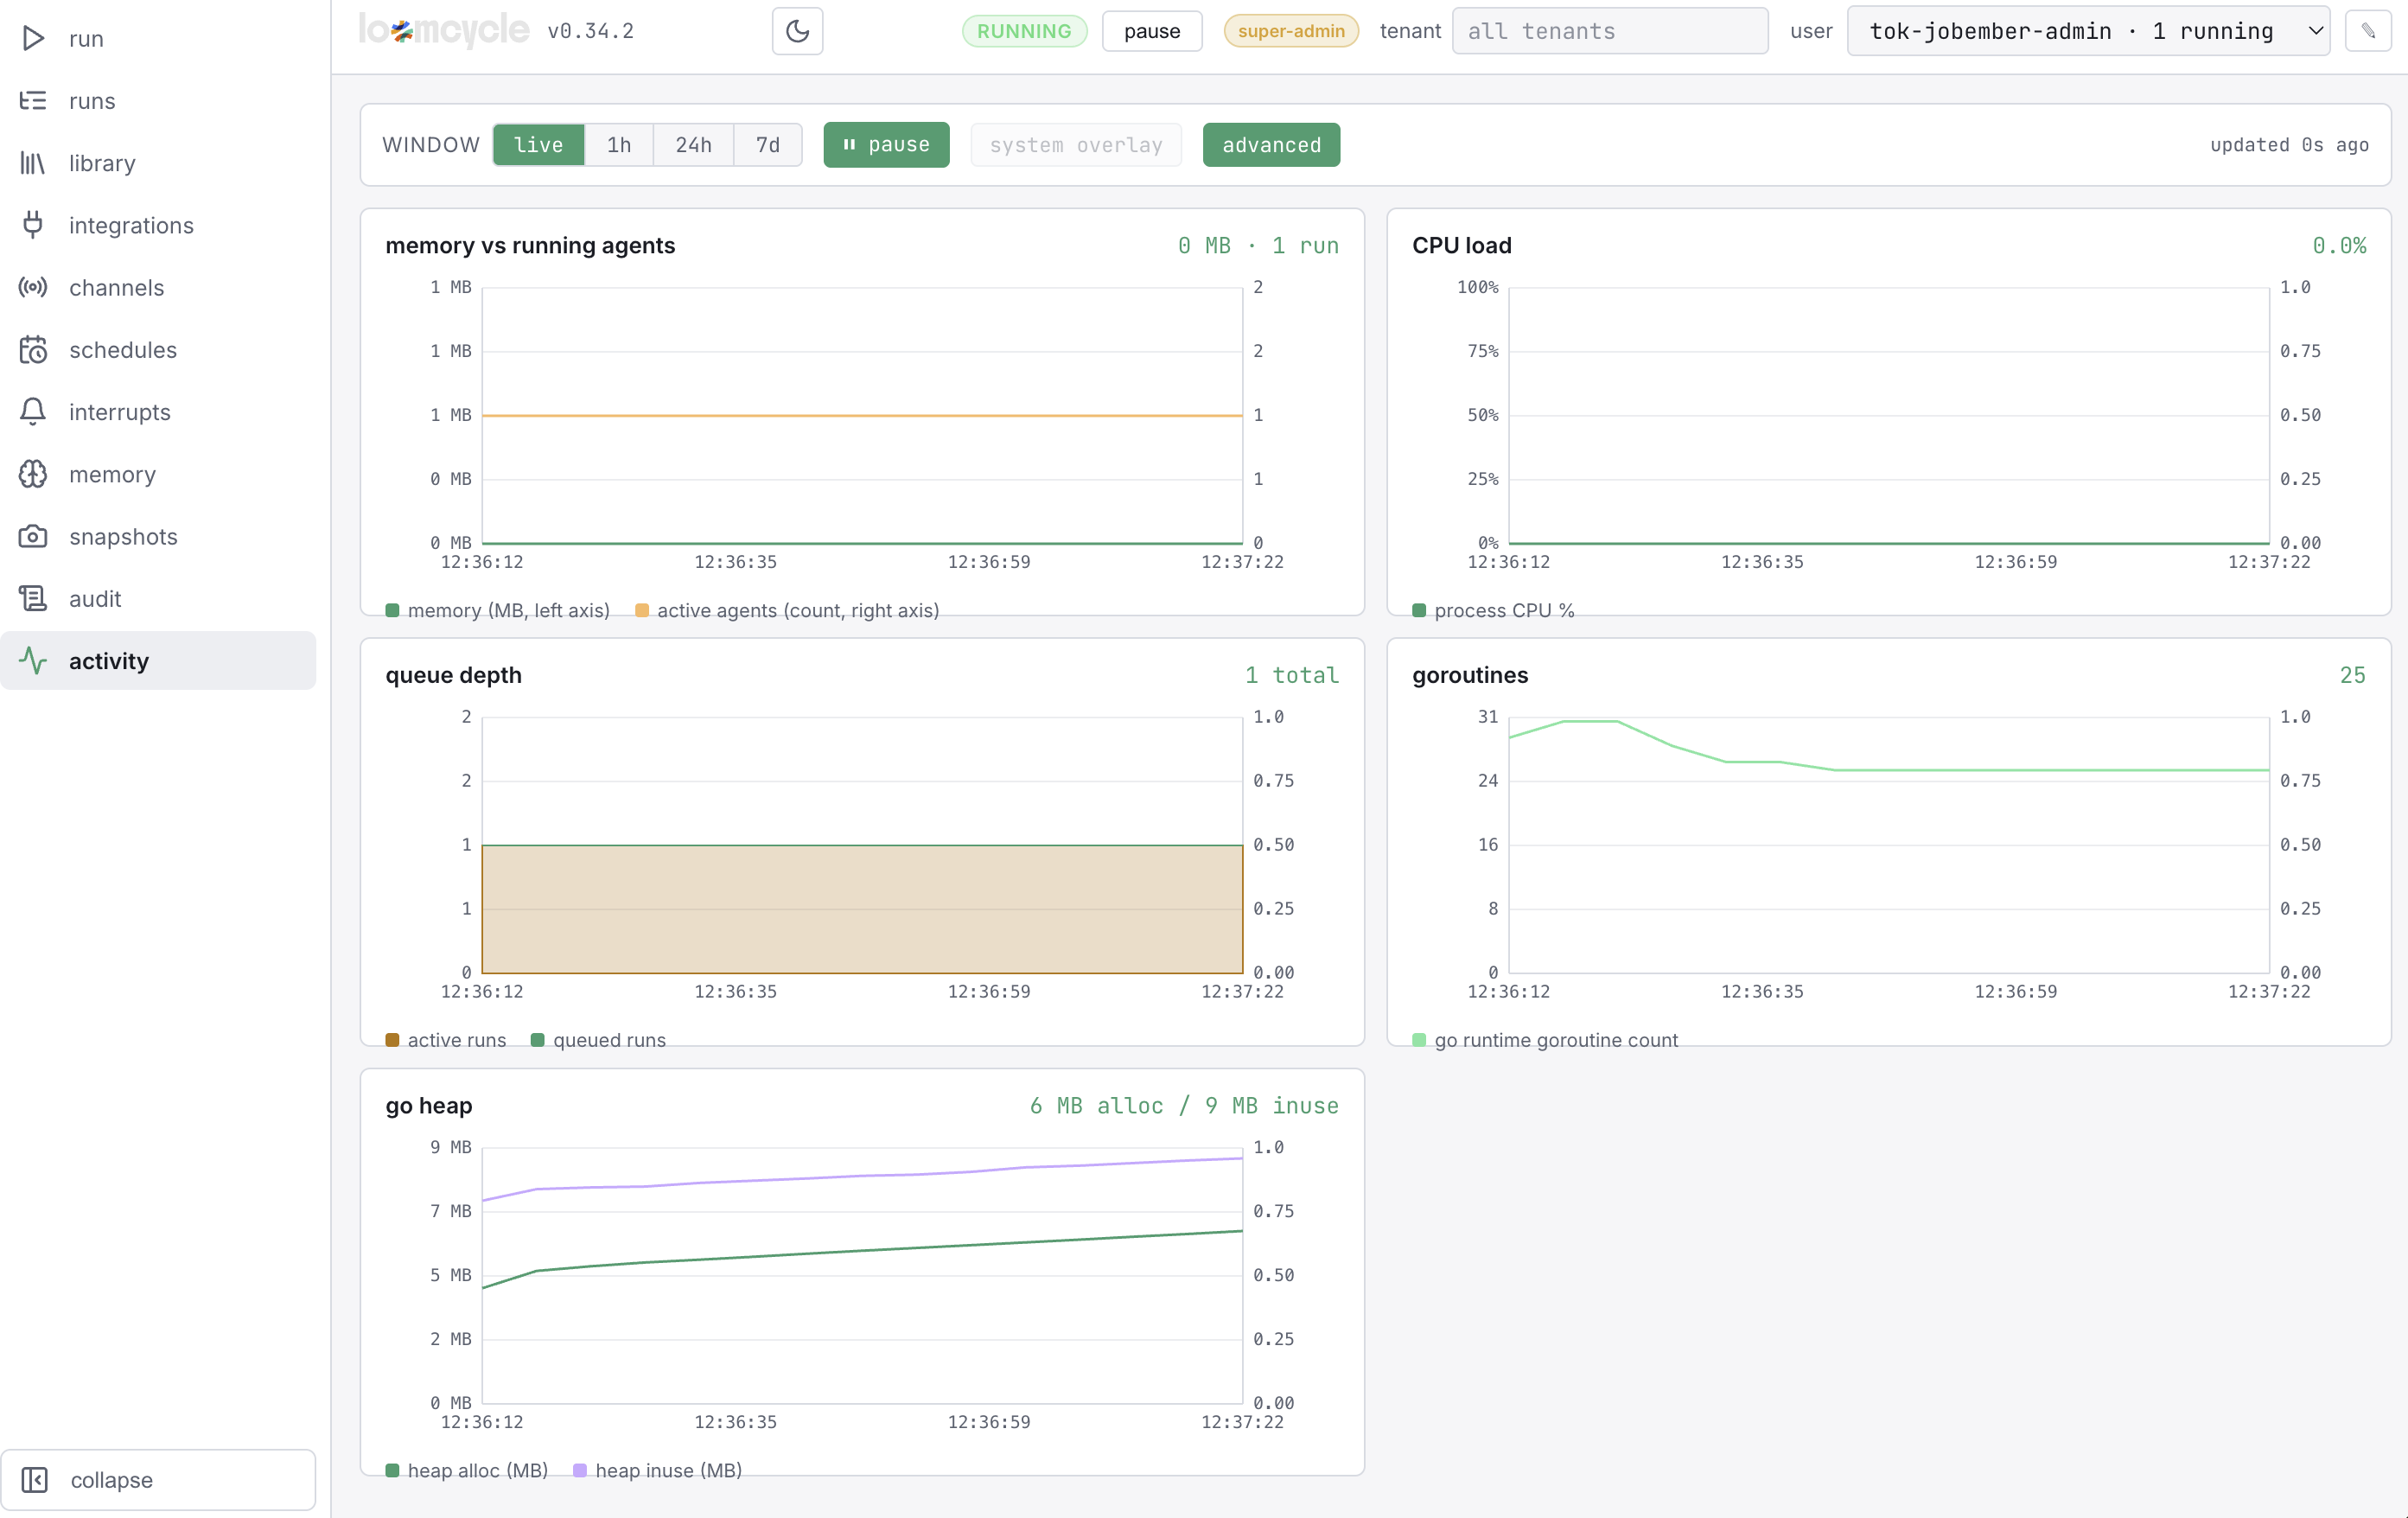
/ui/activity. Same metrics as the OTEL/Grafana view above, but live-read from the runtime's own counters with no exporter in the loop - useful for the operator looking at one replica in isolation, or when Grafana isn't running. The window selector covers live through 7d; sampler ratio is the operator's choice.Experiment 6 - perfectly linear up to x5000
Same r=4 + OTEL setup, but instead of holding scale flat, a five-minute weighted ramp: x3000 for 1 min → x4000 for 2 min → x5000 for 2 min. The question wasn't "does it complete" - sustained had already shown that. It was "how does wall time grow as per-wave scale grows."
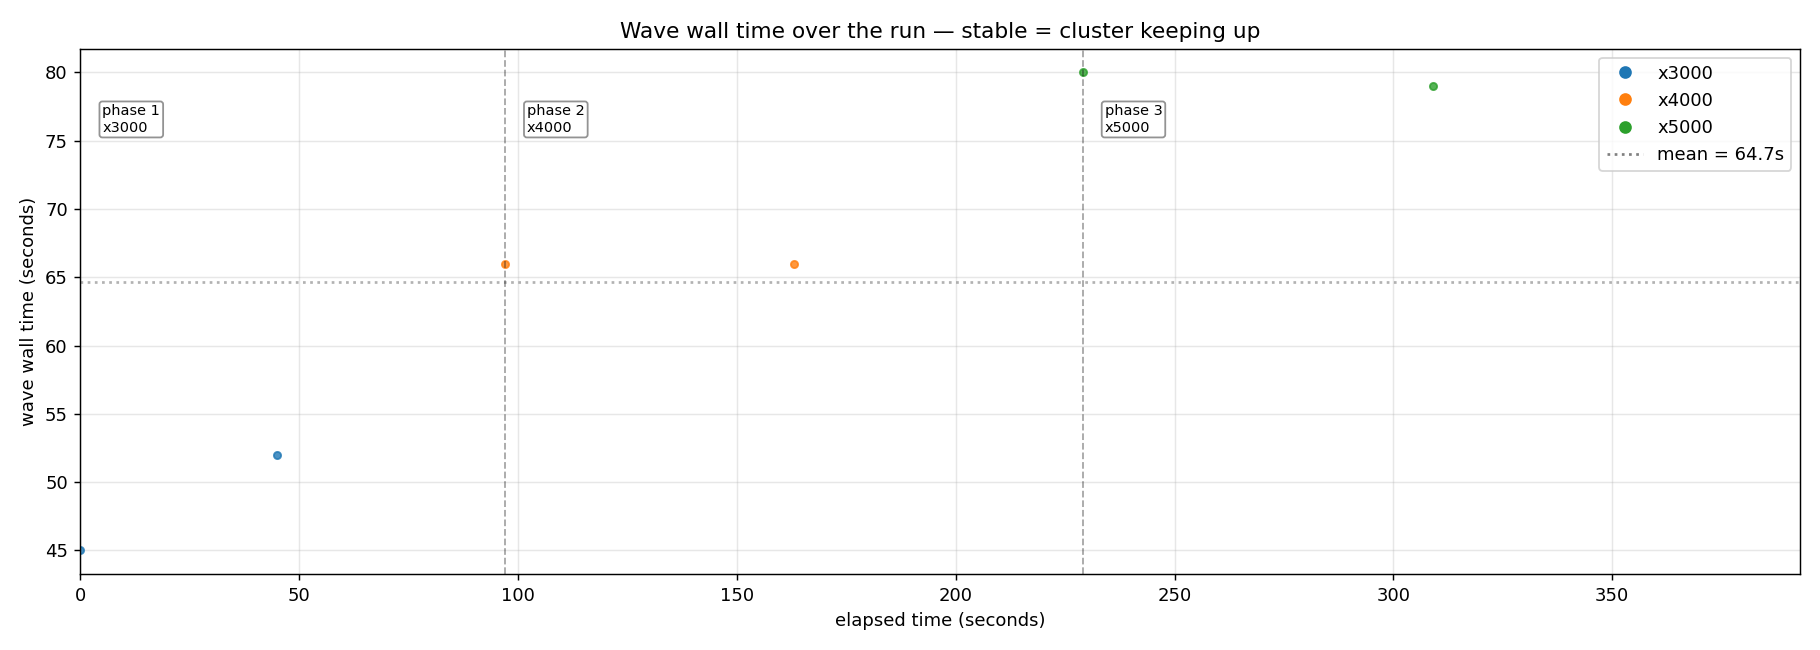
6 / 6 waves at 100 % completion. 24,000 circuits / 72,000 agent runs in 388 s. The wall-time slope across x1000 → x5000 came out to 16 seconds per +1000 circuits, a perfectly straight line. p99 stayed within 3.6-4.2 s across the entire range - meaning the cluster absorbed 5× the per-wave load by spending more wall on each wave, not by slowing individual circuits.
That's the strongest "cluster keeping up" signature possible. If the cluster were close to its keep-up boundary, p99 would diverge upward at the largest scale. It doesn't. The substrate had substantial headroom we hadn't yet characterised - the 15-min and 30-min runs at x1000/x2000 were running at ~30 % of capacity, not 70-80 %.
Experiment 7 - finding the wall, finally
The natural next ramp: x6000 for 3 min → x8000 for 4 min → x10000 for 5 min. Twelve minutes, thirteen waves, and the keep-up boundary finally announced itself.
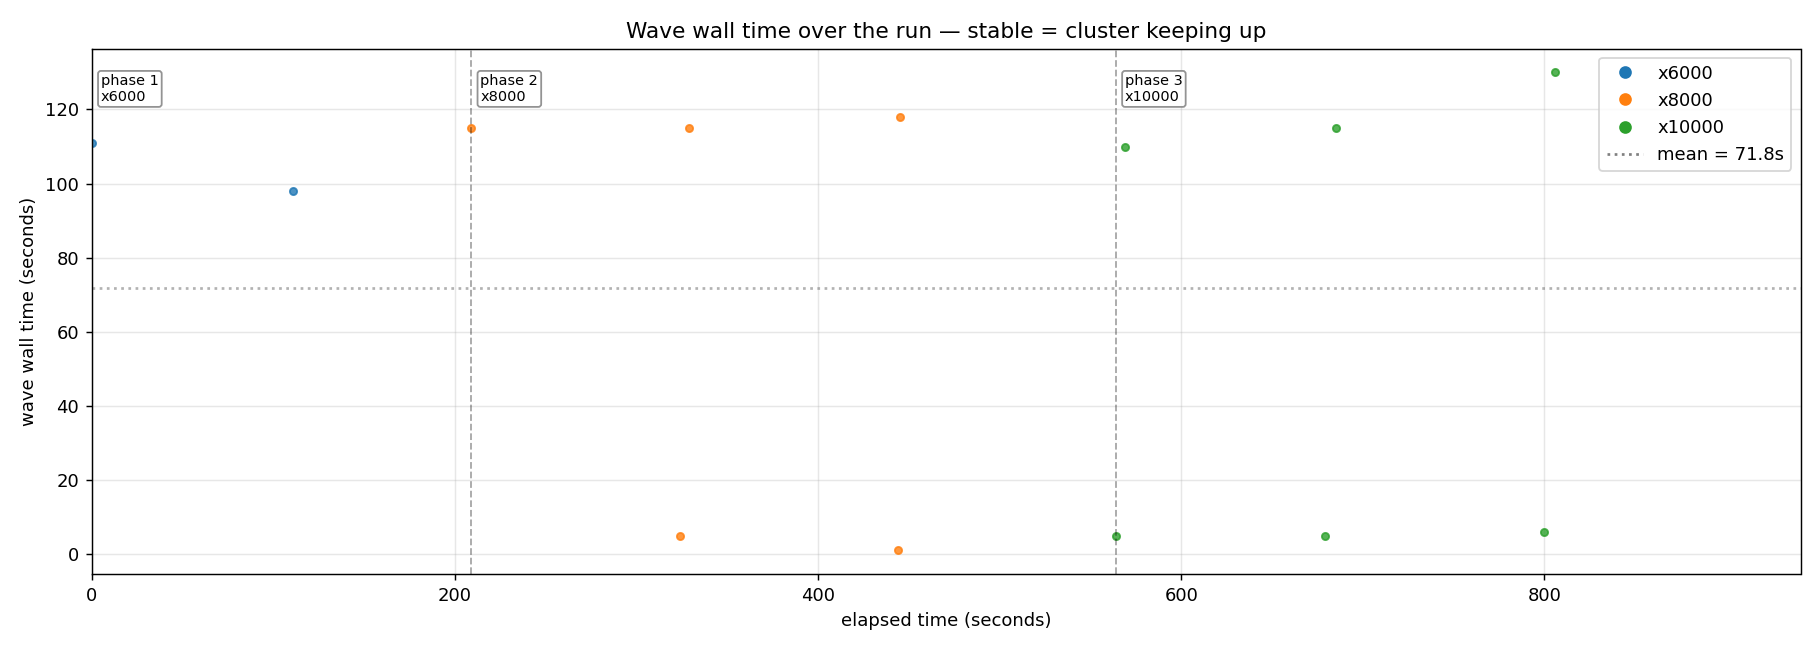
The picture is clear once you read it. Phase 1 (x6000): 100 % completion, p99 ~4.5 s, walls at 98-111 s - the linear regime still holds, just barely. Phase 2 (x8000): 83-84 % completion on the real waves (~6,650 circuits successfully drained per wave), p99 13 s, and a bimodal pattern emerges - every "real" wave at ~115 s is followed by a "collapse" wave at ~1-5 s that fires while the cluster is still draining the previous admission. Phase 3 (x10000): 66-67 % completion on real waves, same bimodal shape, and the real-wave wall does not scale further. It stays ~115 s regardless of whether the requested scale is x8000 or x10000.
The cluster has hit its drain-rate ceiling at ~115 s per wave. Above that, additional circuits per wave don't drain faster; they spill into the launch-collapse waves or fail as silent regressions (the same shape PR #246 fixed at the launch-storm tier, resurfacing here at higher scale). At x10000, 87 silent regressions in the worst wave - out of 10,000 attempted, ~6,650 still completed cleanly.
The shape of the ceiling matters as much as the ceiling itself. Saturation here is soft, not catastrophic - the cluster keeps absorbing a remarkably consistent ~6,650 circuits per wave above the knee, and the overflow degrades gracefully (drop a circuit, or admit fewer next wave) rather than failing the whole run. This is the difference between "the cluster has a capacity" and "the cluster falls over past a capacity." Operators can size load up to the knee with high confidence; past it, the cluster declines visibly and the data tells you you've crossed the line.
Experiment 8 - eight hours of nothing happening
The seven-experiment campaign closed on the promissory note "longer than 30 minutes." Last night we ran it. The phase plan: x2000 for 160 min → x3000 for 160 min → x4000 for 160 min, all three scales sitting comfortably below the saturation knee, back-to-back waves with no idle gap, all on the same r=4 cluster the prior runs used. The point wasn't to find a ceiling - the saturation probe already named that. The point was: does anything leak, drift, or degrade over hours that the 30-minute run couldn't see?
Eight hours and two minutes later: 1,268,000 circuits, 3,804,000 agent runs, 100.00 % completion across all 468 waves. Zero silent regressions. Zero stuck rows. Zero quota leaks. Per-replica load distribution across 3.8 million agent runs: 950,633 / 951,189 / 950,413 / 951,765. A spread of 0.14 %.
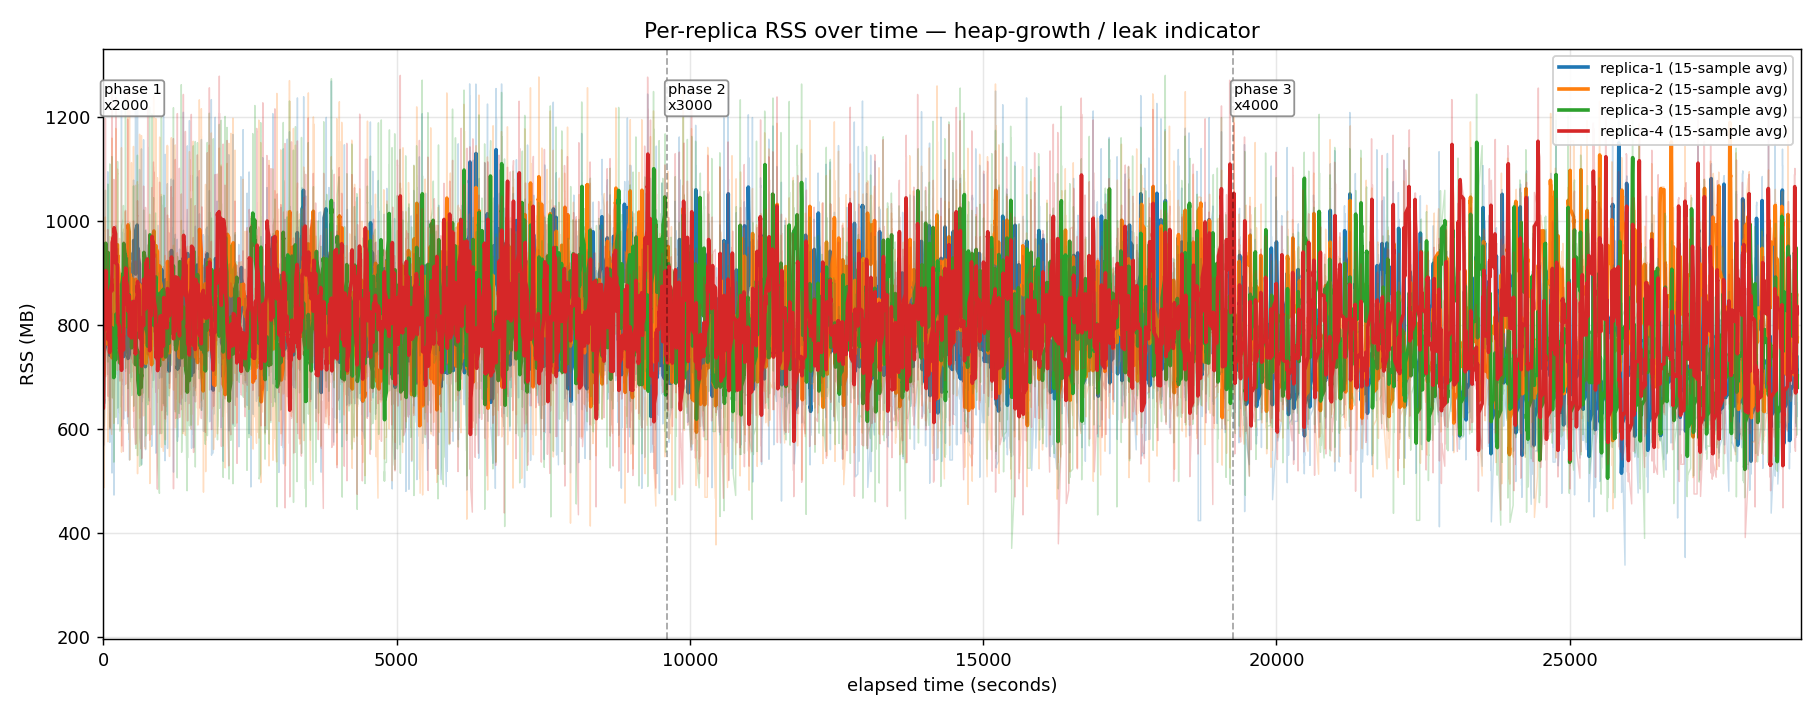
That envelope is the headline. The substrate does not leak: not RSS, not goroutines (separate chart, same flat shape), not connection pool state, not the user_quotas active count. At teardown 0 stuck-running rows, total active quotas at 0. Whatever the prior 30-minute run could and couldn't see, the 8-hour run sees no accumulation. This is the test the multi-hour promissory note from yesterday was asking for.
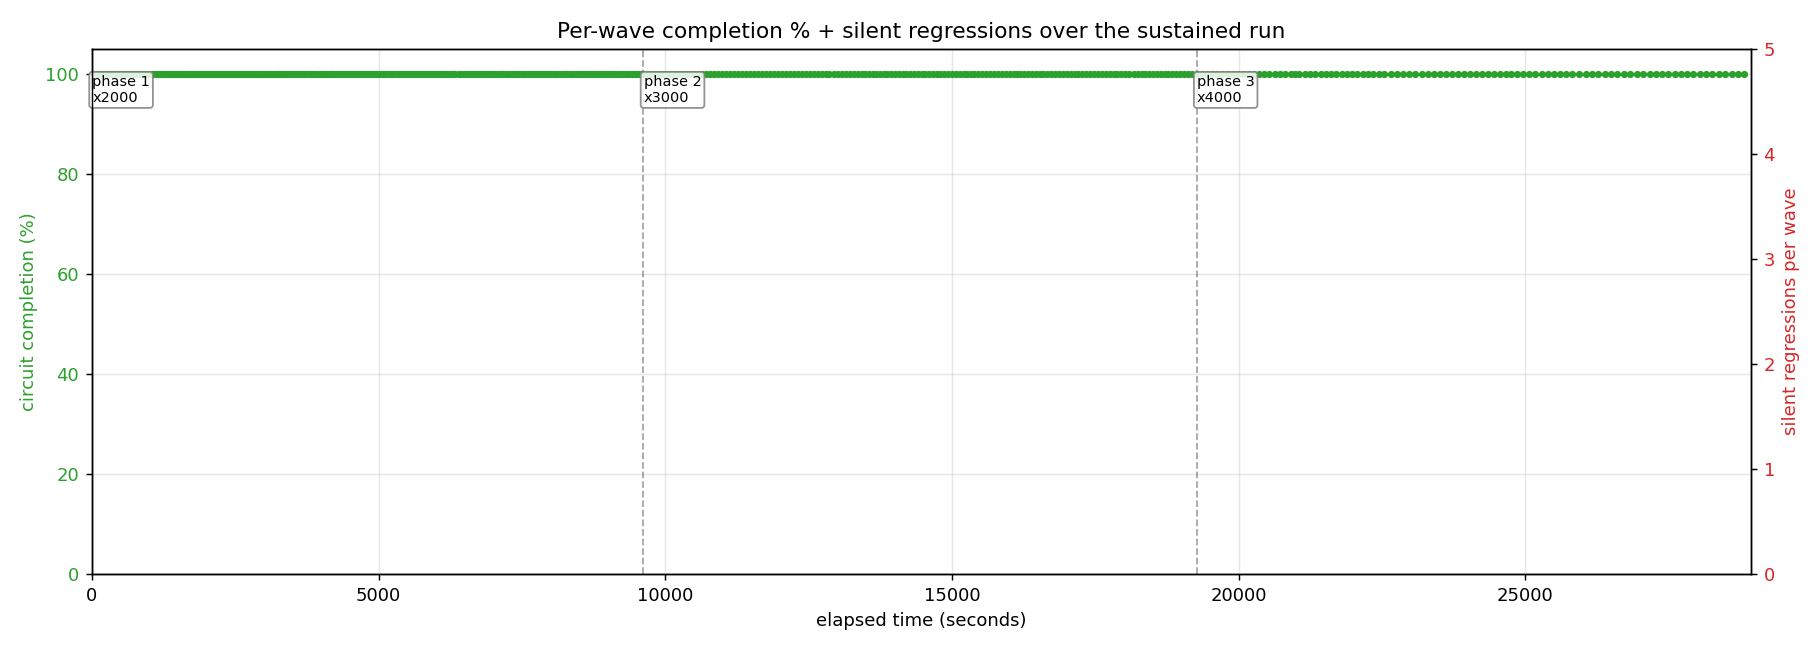
The completion chart says the same thing differently. Green line pinned at 100 % for all 468 waves; red bars (silent regressions, right axis) all zero. Across 1.27 million circuits over eight hours, no wave dropped a single circuit.
Per-replica load distribution at 0.14 % spread isn't the marketing-friendly statistic it sounds like - it's the law-of-large-numbers signature. The 30-minute run had a 0.5 % spread; the 15-minute run had 0.7 %. As wall time grows, the spread tightens - which is exactly what a properly load-balanced round-robin pool should do, and exactly what the substrate's per-run replica ownership stamping records. The cluster's load-split fairness is durable at long duration, not just in burst.
The two findings the campaign couldn't see in 30 minutes
The headline is "the substrate doesn't break." The honest findings are the parts the campaign's shorter experiments couldn't see at all, and they're the more interesting story. Both showed up because we finally ran for long enough.
Finding 1 - two unexplained within-phase step-ups in wave wall time. Phases 1 and 3 each have a sharp ~13-second step-up in wave wall time at wave 101 of the phase - that's roughly an hour in. Phase 2 doesn't; it's internally stable throughout (stdev 3.0 s vs phase 1's 7.2 s and phase 3's 9.5 s). The cluster handles both step-ups transparently - completion stays pinned at 100 % - but the mechanism is uncharacterised substrate behaviour.
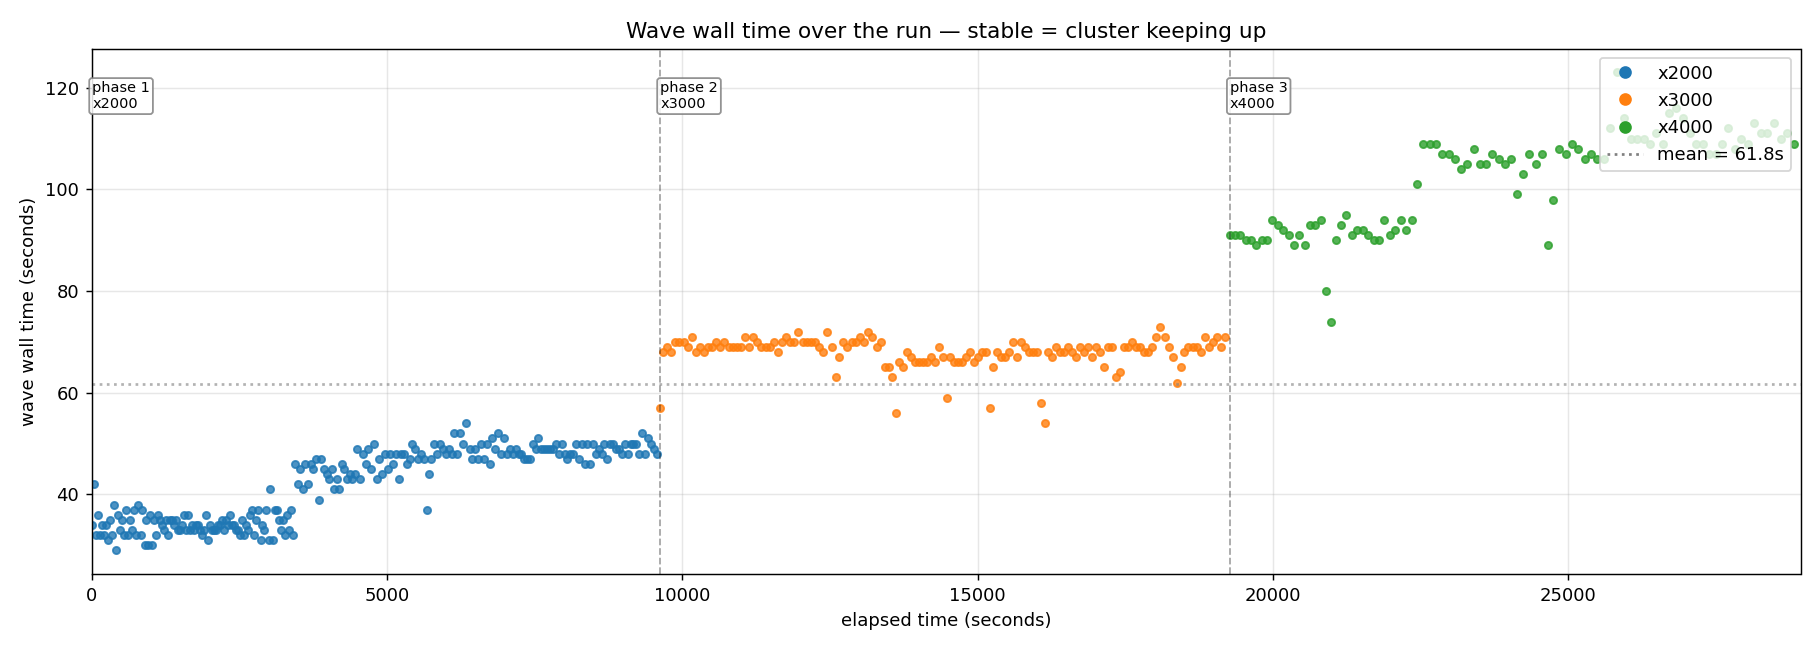
Three hypotheses, each with a concrete follow-up experiment:
- Postgres autovacuum. By T+3500 s the cluster has written ~6 M event rows; autovacuum's defaults (50 + 0.2 × n_live_tuples) put the threshold at ~1.2 M dead tuples - easily reached given MVCC's
UPDATE-creates-a-dead-tuple semantics. Once vacuum runs, query plans refresh and the table's effective size drops. Both shift per-iteration store cost. Test: re-run withautovacuum=off; if the step-ups vanish, hypothesis 1 is confirmed. - Go GC heap threshold. Default
GOGC=100triggers GC when heap doubles. As the heap grows toward steady state, each GC takes longer, and at some heap size the pauses become measurable. Test: re-run withGOGC=200; if step-ups land later or shrink, hypothesis 2 is confirmed. - OTEL exporter backpressure. Tempo and Prometheus rotate on-disk segments; rotations briefly throttle write throughput. If the OTEL exporter sees backpressure inside the iteration span, the latency lands on the wall. Test: re-run with
LOOMCYCLE_OTEL_TRACES_SAMPLER_RATIO=0; if step-ups vanish, hypothesis 3 is confirmed.
The data captured doesn't distinguish between them. Three 8-hour follow-up runs (24 hours of cluster time) would. We don't have the data; we have the experiment designs. Naming what we don't know precisely is the honest reading.
Finding 2 - the new substrate's measured per-iteration tax. The prior 30-minute run sustained ~180 agent runs/sec. This 8-hour run averaged ~131 across the same r=4, same hardware, same OTEL sampler ratio. A 27 % throughput drop. Peak RSS per replica went from ~270 MB to ~850 MB - a 3.5× increase. Peak goroutines per replica from ~660 to ~1,770. p50 baseline doubled (~2.5 s to ~5 s).
The cause is straightforward and worth naming clearly. Between the rig PR that produced the prior cached image and this run, 21+ commits landed on main: A2A protocol (server + client, three bindings), parent-context lineage propagation, the RFC E ScheduleDef substrate with its in-flight tracker, the RFC F per-run credentials map, the curated MCP recipe library, and the Claude Code interop trio. Each contributes some persistent state and some per-iteration cost. Their cumulative effect on the hot iteration path is real and measurable.
The cluster is still well within its capacity envelope. x4000 at the soak's peak sits at maybe 80 % of the saturation knee - none of these features destabilised anything; they made the iteration ~30 % more expensive. That's a tax, not a bug. The right next step is a pprof sample during a future run to attribute the cost across the new features and rank them, so the per-iteration optimisation work has data to start from.
The finding that matters most about Finding 2 is that we can name it at all. Every prior substrate release shipped with no measured per-iteration baseline against the prior release on identical hardware. The campaign through experiments 1-7 established a method; experiment 8 used that method to put a number on what two weeks of substrate work cost on the hot path. The number isn't surprising - adding A2A handlers, parent-context state, ScheduleDef sweepers, and a credentials substitution path costs something. What's new is that we have the number, and it gives the v1.0 hardening pass a concrete target. The cost is real; it's also tractable, and now there's a baseline to optimise against.
What the campaign establishes
Two claims, each backed by specific data points:
Reliable under stress. The single-binary baseline holds 10,000 circuits at p99=4.0 s on this hardware. The cluster's r=2 → r=3 phase transition pulls p99 from 54 s back down to 3.6 s - and from r=3 upward, every burst experiment was 100 % completion with zero silent regressions through x5000. Cross-replica cancel acks in 130 ms p99 (38× under default timeout). Crash recovery completes in ~20 s with the reaper path named in the run data itself. The cluster doesn't merely scale; its failure modes are tractable, observable, and bounded.
Sustainable for hours. 15 minutes of continuous load: 56,000 circuits, zero drift. 30 minutes with a live OTEL stack underneath: 109,000 circuits, load distributed across four replicas within 0.5 %, the OTEL pipeline holding up at sampler ratio 1.0. And - the eighth experiment - eight hours of continuous load at r=4 across three escalating scales: 1,268,000 circuits, 3,804,000 agent runs, 100.00 % completion across all 468 waves, the per-replica load split to 0.14 % across 3.8 million agent runs, and the RSS rolling-mean envelope flat from T+0 to T+28,930. The capacity probe extended the envelope to x5000 per wave at perfectly linear wall, and the saturation probe finally named the soft ceiling between x6000 and x8000. Eight hours of continuous load is the property the v1.0 launch claim was missing; the runtime did it without leaking and without dropping a single circuit.
The numbers are tied to this hardware, this Postgres, this pool sizing, this provider profile (mock at 15 % injected 429). Scaling them to your deployment requires re-running on your hardware - that's what the harness is for, and what the OTEL stack lets you observe at production wire shape. What the campaign establishes is the method of measurement and the shapes to expect: linear up to a knee; soft saturation past it; flat over time within capacity; cluster mode worth its overhead only above r=2.
"Closer to v1.0" looks like this in evidence, not vibes. A week ago the reliability claim was qualitative: Apache-2.0, multi-replica HA shipped, OTEL native, the architectural pieces in place. After this campaign it's quantitative. Linear capacity up to a named knee. Soft saturation past it. Eight hours of zero drift across 1.27M circuits and 3.8M agent runs. Cross-replica primitives working at scale. Failure modes that are tractable, not catastrophic. The 30-minute run gave us "no drift we could see in 30 minutes." The 8-hour run gave us "no drift in 8 hours, plus two findings we can name and three follow-up experiments we know how to run." Sustainable-with-data, not sustainable-on-paper. The remaining work (within-phase step-up mechanism, per-iteration tax breakdown, real-provider RTT, pgxpool fix paths, heterogeneous-replica fairness) is sizing + characterisation, not load-bearing unknowns. v1.0 sits a meaningful step closer than it did a week ago.
What's left to verify
- The mechanism of the two within-phase step-ups. Three hypotheses sketched above - autovacuum / GC / OTEL backpressure - each with a concrete follow-up experiment design. 24 hours of cluster time runs all three in series. The cluster handles the transitions transparently today, so this is characterisation work, not a fix.
- Rank the per-iteration tax across the new substrate code. The 27 % throughput drop attributed to 21+ commits of new substrate features needs a
pprofsample during a 30-min run + flame-chart attribution to know which features cost what. The optimisation pass that comes next needs that ranking to start from. - Real provider RTT in the loop. Mock zero-latency calls maximise the load on the substrate but compress the time spent in the agentic loop. A real-provider re-run (~1-3 s per call) stretches per-circuit time ~25×, which pushes the same pool ceiling out to "much higher concurrency at much lower QPS" terrain - closer to typical production shape.
- Heterogeneous replica sizes. All four replicas here were identical. Production clusters often run mixed-size pods; the load-split fairness story needs verifying under unequal capacity.
- The pgxpool fix paths from the earlier writeup. The substrate's pool contention is still the next-deepest ceiling; the three options from that writeup (bump
pg_max_open_conns, shard agent → connection, per-replica hot-path cache) remain the immediate PR work. - Re-verify the saturation knee with the new code. The saturation probe was run before the 21+ commits landed. Re-running x6000-x10000 with the higher per-iteration baseline tells us whether the knee moved with the substrate's new baseline cost.
None of these are blockers in the sense of "the runtime has a known structural problem." They're blockers in the sense that the v1.0 tag would otherwise carry claims it hasn't tested. The campaign so far is the foundation; the remaining items are what makes the claim production-grade rather than benchmark-grade.
Eight experiments, three days, one Xeon. The cluster scales across replicas in steps, not curves. It stays flat under sustained load. It stays flat for eight hours of sustained load. The OTEL stack you'd run in production held up under both the 30-minute and 8-hour write volumes. The saturation knee is named, the failure mode past it is gentle, and the two findings the 8-hour run surfaced (the wave-wall step-ups and the per-iteration tax) are characterised enough to write follow-up experiments against. That's what "reliable under stress and sustainable for hours" means in measured numbers. The foundation the v1.0 launch claim sits on.
Companion writeups: 15,000 agents on a synthetic provider (yesterday, the launchSem + mock-provider work this campaign built on), Multi-replica HA, the seven phases that get loomcycle close to v1.0 (the cluster primitives the burst sweep exercises), Three MCP tokens in one run (the per-run-credentials work that ships alongside this one).